Optimizing the Geospatial Data Chain for Learning and Adaptive Management in Malawi
In the heart of Malawi, a country facing multifaceted development challenges, the United States Agency for International Development (USAID) seeks to strengthen governance, expand educational and economic opportunities, and promote the growth of the private sector. USAID/Malawi is pioneering an integrated approach to development by optimizing synergies across its development sectors. In addressing these challenges, the USAID Mission tracks data and information flows across its four technical offices and 40+ activities related to performance monitoring and results. With different timelines, technical objectives, and contractual mandates, integrating Mission activities through intentional collaboration and strategic learning across sectors requires a proactive approach.
To strategically integrate its activities, the Mission needs to share information in a timely manner on the location of interventions and coordinate their design and implementation. Granular data on the location of activities across the portfolio are required to understand the extent to which integration is even possible. Banyan Global’s Learn to Perform Activity offers a full suite of monitoring, evaluation, and learning (MEL) services to USAID/Malawi and its partners to provide evidence and information on the key learning priorities, including the impact of co-located activities and the Mission’s integrated approach. Now in its second year of implementation, Learn to Perform has provided a wide range of support to strengthen the Mission’s geographic information system (GIS), a critical element of managing the performance and monitoring the effectiveness of the Mission’s integrated strategy.
 Over the past year, Learn to Perform has bolstered the Mission’s GIS usage across the full data chain: improving the availability and quality of geospatial data in the Mission’s geographic information system and providing learning and data visualization expertise to maximize its use for data-driven decision making. From the onset, Learn to Perform worked closely with the Mission’s GIS Specialist to develop USAID/Malawi’s GIS platform and continues to support its management. In November 2022, Learn to Perform conducted one-on-one orientations sessions with implementing partners on accessing the and submitting data to the platform. This resulted in an online GIS platform that provides the Mission with a comprehensive repository of activity location data.
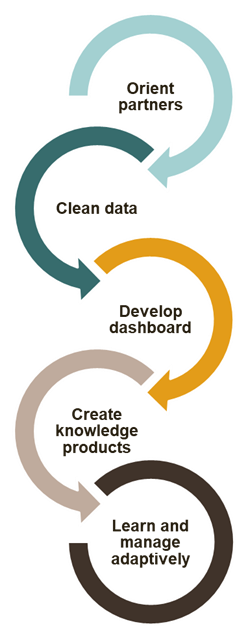
Learn to Perform’s GIS support enables USAID to integrate geospatial data from various activities into one platform, with access to information about interventions implemented at various levels (facility, traditional authority, district, and regional[1]) to understand synergies and avoid duplication of efforts. The first year of implementation culminated in a prototype of a dynamic interactive dashboard, drawing upon the GIS database that Learn to Perform expanded. This dashboard, a testament to Learn to Perform’s innovation, generates online maps, empowering USAID to visualize interventions by sector and development objective, down to the district and traditional authority level. Learn to Perform has used this dashboard to generate over a dozen on-demand maps, including products which USAID has used to support strategic learning and adaptation in its annual Portfolio Review, to map integration of education and HIV interventions, and to support Local Works implementing partners in work planning.
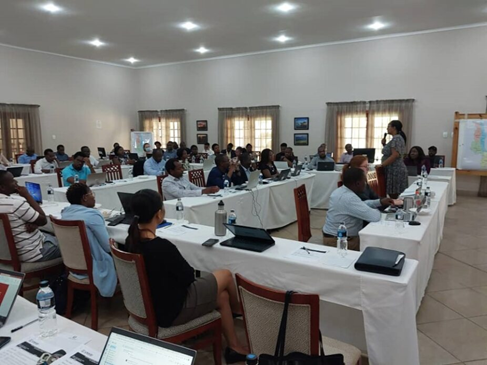
Participants at Learn to Perform’s GIS training workshop
Following development of the GIS platform, Learn to Perform continued to provide on-demand, one-on-one orientation sessions with USAID implementing partners on accessing and submitting GIS data to the platform. To date, Learn to Perform has oriented staff from 52 USAID activities on the GIS platform. Following these sessions, the percentage of implementing partners reporting geo-tagged data to USAID increased from 63 percent of those who participated in the sessions to 84 percent, equipping the GIS platform with 1144 mapped locations at the traditional authority level.
The impact is palpable. USAID leverages these tools to bolster strategic learning, evident in the annual Portfolio Review and in mapping the integration of education and HIV interventions. Through these GIS-based knowledge products, Learn to Perform has fostered an appreciation for and utilization of GIS among Mission staff, with a significant percentage now incorporating GIS data into decision-making processes. In addition to training IPs in the submission of GIS data, Learn to Perform also supports the Mission by systematically reviewing and cleaning facility-level geospatial data to ensure the accuracy and completeness of GIS data available to USAID/Malawi.
Banyan Global’s GIS services provide real-time and highly localized data-driven knowledge products that support collaboration, learning, and adaptive management. The GIS platform and knowledge products we developed will continue to provide the Mission with essential tools for designing and monitoring interventions across sectors in support of its integrated strategy. In the face of Malawi’s complex development landscape, Banyan Global’s commitment to integrating GIS through the Learn to Perform Activity showcases the power of optimized geospatial data to inform decision-making. Our efforts towards improved collaboration, strategic learning, and adaptive management pave the way for a brighter development landscape in Malawi.
[1] There are 28 districts in Malawi. Each of these districts is organized into sub-administrative sects at the local government level, which are called traditional authorities. These comprise of smaller sects of (on average) three to five group villages.
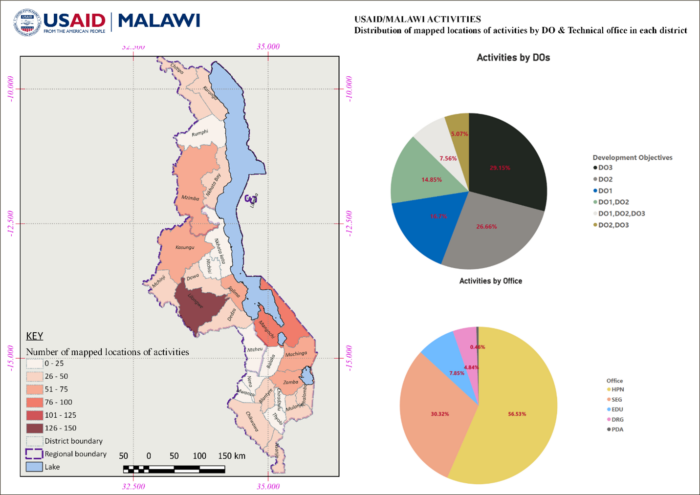
Figure 1. Map showing the number of mapped USAID activities by district
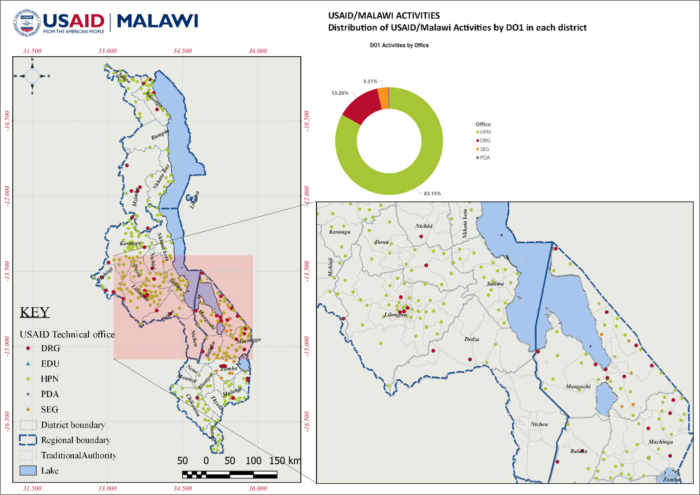
Figure 2. Map showing the locations of USAID activities under Development Objective 1
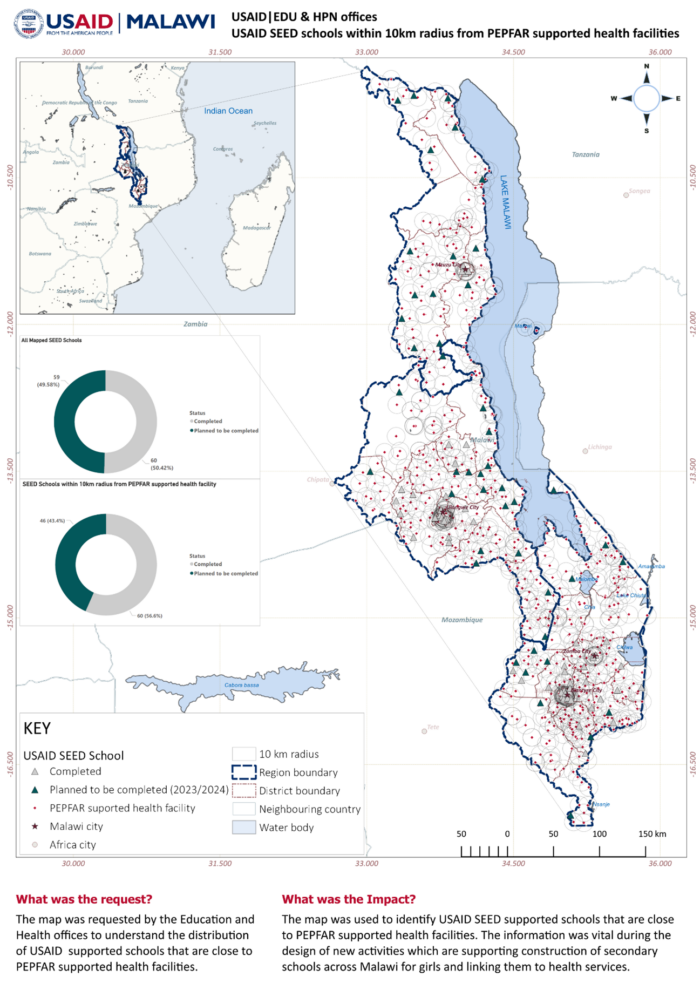
Figure 3. Map showing the distribution of estates within the Feed the Future zone of influence
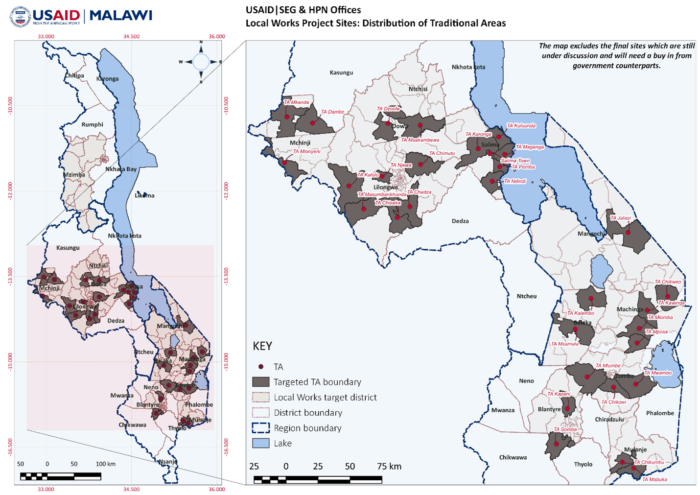
Figure 4. Map showing the distribution of traditional authorities where Local Works activities are being implemented